OCTOBER KEY FIGURES
 |  | Oct 07 | Sep 07 to Oct 07 | Oct 06 to Oct 07 |
 |  | no. | % change | % change |
|
| TREND |  |  |  |
 | Total dwelling units approved | 13 483 | 1.1 | 5.4 |
 | Private sector houses | 9 179 | 1.4 | 3.6 |
 | Private sector other dwellings | 3 842 | 0.7 | 6.0 |
| SEASONALLY ADJUSTED |  |  |  |
 | Total dwelling units approved | 13 553 | -2.8 | 9.1 |
 | Private sector houses | 9 288 | 0.9 | 7.6 |
 | Private sector other dwellings | 3 947 | -5.5 | 12.4 |
|
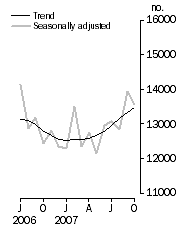
Dwelling units approved, Total number

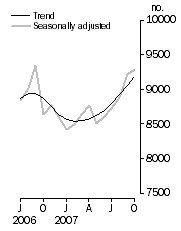
| Private sector houses approved, Total number

|
OCTOBER KEY POINTS
TOTAL DWELLING UNITS
- The trend estimate for total dwelling units approved rose 1.1% in October 2007.
- The seasonally adjusted estimate for total dwelling units approved fell 2.8% in October following a revised increase of 8.6% in September.
PRIVATE SECTOR HOUSES
- The trend estimate for private sector houses approved rose 1.4% in October and has been rising since March 2007.
- The seasonally adjusted estimate for private sector houses approved rose 0.9% in October following a revised increase of 3.7% in September.
PRIVATE SECTOR OTHER DWELLING UNITS
- The trend estimate for private sector other dwellings approved rose 0.7% in October following a revised increase of 1.2% in September.
- The seasonally adjusted estimate for private sector other dwellings approved fell 5.5% in October following a revised increase of 17.8% in September.
VALUE OF BUILDING APPROVED
- The trend estimate for the value of total building approved rose 1.7% in October. The trend estimate for the value of new residential building approved rose 1.9%, and the value of alterations and additions rose 1.9%. The value of non-residential building approved rose 1.3%.
- The seasonally adjusted estimate for the value of total building approved rose 14.8% in October. The seasonally adjusted estimate for the value of new residential building approved rose 1.8% in October. The seasonally adjusted estimate for the value of alterations and additions fell 7.2% and the value of non-residential building rose 36.1%.
NOTES
FORTHCOMING ISSUES
| ISSUE | Release Date |
| November 2007 | 8 January 2008 |
| December 2007 | 5 February 2008 |
| January 2008 | 6 March 2008 |
| February 2008 | 7 April 2008 |
| March 2008 | 1 May 2008 |
| April 2008 | 3 June 2008 |
CHANGES IN THIS ISSUE
Quarterly chain volume data in this issue incorporate a new base year, 2005-2006, which has resulted in revisions to growth rates, small in most cases, for the last few years. In addition, the reference year has been advanced to 2006-2007, which has resulted in revisions to levels, but not growth rates, for all periods.
REVISIONS THIS MONTH
Revisions to the total number of dwelling units approved in this issue are:
 | 2006-07 | 2007-08 | TOTAL |
|
| NSW | 52 | -56 | 4 |
| Vic. | 8 | 9 | 17 |
| Qld | 76 | 6 | 82 |
| SA | - | - | - |
| WA | -1 | 109 | 108 |
| Tas. | 52 | 94 | 146 |
| NT | -1 | - | -1 |
| ACT | - | -23 | -23 |
| Total | 186 | 139 | 325 |
|
The revisions to the number of dwelling units in Tasmania and Western Australia are primarily the result of data being supplied late due to software errors.
One permit, which was included in error in the July 2007 data and removed during October processing, contributed an $84m downward revision to the value of non-residential building approvals in Queensland.
DATA NOTES
There are no notes about the data.
INQUIRIES
For further information about these and related statistics, contact the National Information and Referral Service on 1300 135 070 or Paul Pamment on Adelaide (08) 8237 7648.
 Print Page
 Print All